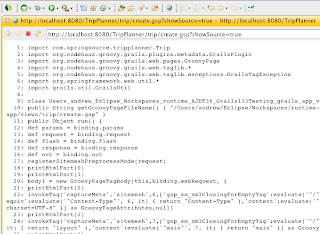
A basic trick of Groovy Server Page debugging that seasoned Grails developers know is that by adding ?showSource=true to a URL for any of your GSPs you can view the Groovy translation of your GSP code. For example, the vanilla create GSP (http://localhost:8080/TripPlanner/trip/create.gsp) gets rendered like this in the browser:
And altering the URL to this: http://localhost:8080/TripPlanner/trip/create.gsp?showSource=true, you can see the translated source:
There is a mapping between lines of code of the original GSP and the lines of code of the Groovy translation. In fact, if you are using Grails 1.3.4 or above, and scroll to the bottom of the translation, you will see something like this:
 82: @org.codehaus.groovy.grails.web.transform.LineNumber(
  83:  lines = [3, 1, 1, 1, 1, 1, 1, 1, 1, 1, 1, 1, 1, 1, 1, 1, 1, 3, 3, 6, 6, 6, 7, 7, 8, 8, 9, 9, 9, 9, 9, 10, 10, 10, 11, 13, 13, 13, 13, 13, 13, 14, 14, 14, 14, 14, 17, 17, 18, 18, 19, 19, 20, 21, 23, 23, 23, 23, 25, 25, 26, 35, 35, 35, 35, 37, 37, 37, 39, 39, 39, 1, 1, 1, 1, 1, 1, 1, 1, 1, 1, 1],
  84:  sourceName = "create.gsp"
  85: )
  86: class ___LineNumberPlaceholder { }
This is the line mapping information and each element of the lines array maps a line from the translation (the array index) to a line in the original source code (the value at that index). This is not particularly useful to humans, but it is to the SpringSource Tool Suite.
Using this information, STS is finally able to provide some debugging support for GSP files. You can set a breakpoint at a line in your GSP editor, and the debugger will pause at that line when it is reached while rendering the page:
At this point, your GSP can be interacted with like any Groovy file. For example, you can inspect the current state of variables in your page binding:
And you can execute values in the display view (using Java syntax only for now):
This feature has been fun to implement since it was my first foray into Eclipse's Java debug interface, but I am not sure how useful it is going to be. Lines in a GSP are not executed sequentially. Rather, many are executed out of order through closures inside of an invokeTag method call. Also, I have not completely worked out how to determine if a breakpoint is at a valid location if Grails is not already running. So, at this point it is possible to set a breakpoint on any blank line, but these breakpoints are only valid if they are set on a line containing a GSP tag or some other kinds of things.
But, I do hope this is useful to you and if you are interested in trying this new feature out, then you can download STS 2.5.0M3 and install the latest version of Grails tool support. Enjoy!


